

Stephen Harvey
Chief Investment Strategist
Sagard
What’s in this article?
- What is a goals-based approach to asset allocation?
- What are the key client goals?
- What roles can alternative investments play?
- How should investors think about liquidity
- How can a goals-based portfolio come together?
- The bottom line
What is a goals-based approach to asset allocation?
Portfolio construction is often framed as a split between traditional assets and alternatives, with the discussion centered on how much to allocate to alternatives. But, there is another approach. A goals-based framework flips that logic, starting with what the portfolio needs to achieve, working backward to the most effective allocation mix.
In this piece, we’ll review the goals-based approach, the roles alternative investments can play in a portfolio, understanding liquidity factors, and putting it all together.
What are the key client goals?
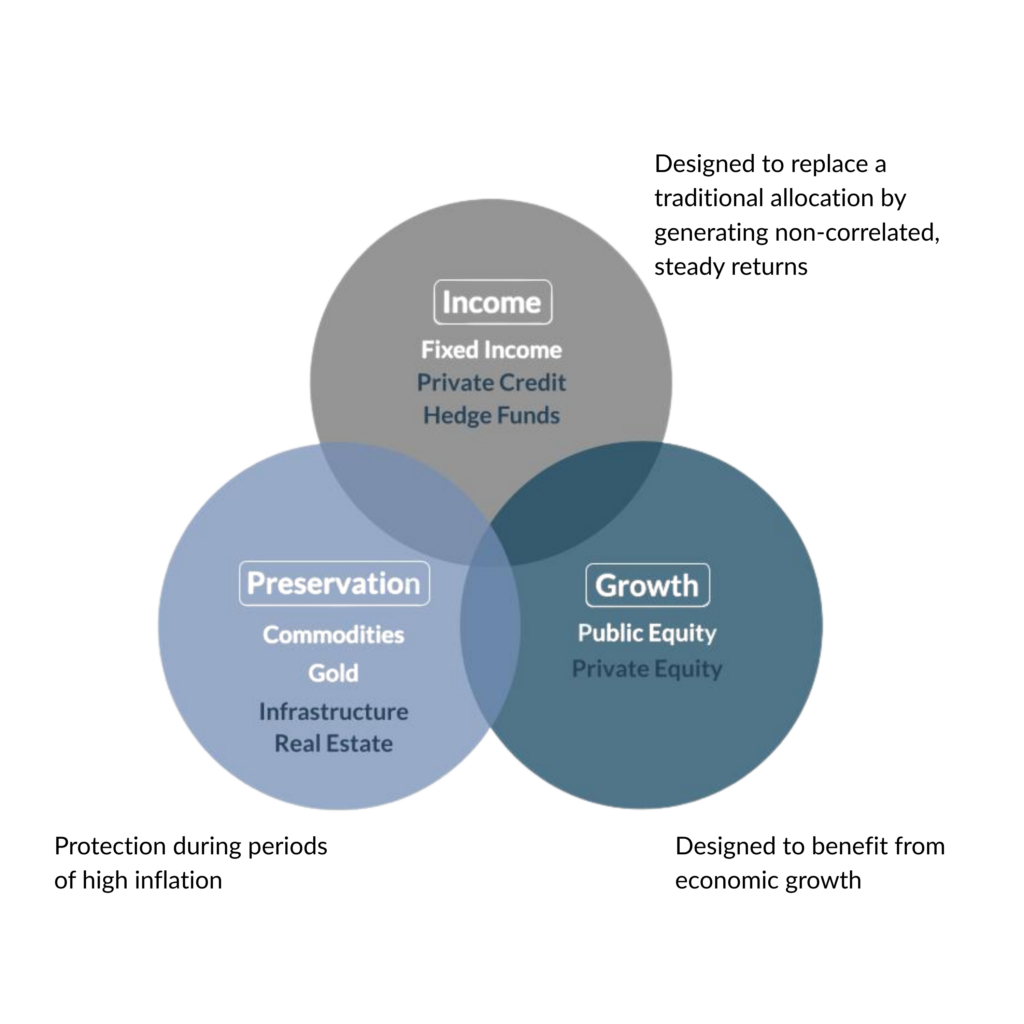
Client goals can be sorted into three key buckets:

In a goals-based approach, alternative investments can be used across all three of these bucketed groups, diversifying the sources of return by goal, instead of diversifying by public versus private markets.
As the below graphic demonstrates, there are alternative and traditional investments in all three goals buckets. This approach enables portfolio construction that allows for broader diversification, expands potential sources of return, and distinguishes between goals, rather than simply splitting ‘traditional and alternative’.
What roles can alternative investments play?
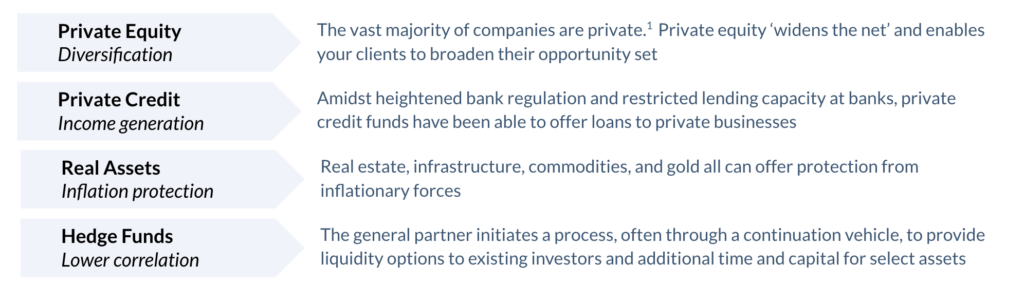
The word alternative is used a lot in the asset management industry, with little explanation on what differentiates the strategies. The table below shows four kinds of alternatives, their differentiating factors in generating returns for clients, making them alternative.
How should investors think about liquidity?
The next phase of the approach is to ensure that the portfolio is aligned with client liquidity needs. Where liquidity is less essential for clients, they should expect greater returns for less liquid approaches.
Historically, public equity and private credit outperformed liquid credit.2 Our outlook is that private strategies should outperform public equities and credit (over a cycle) by 1-3%. Today’s market backdrop appears to make this possible.
How can a goals-based portfolio come together?
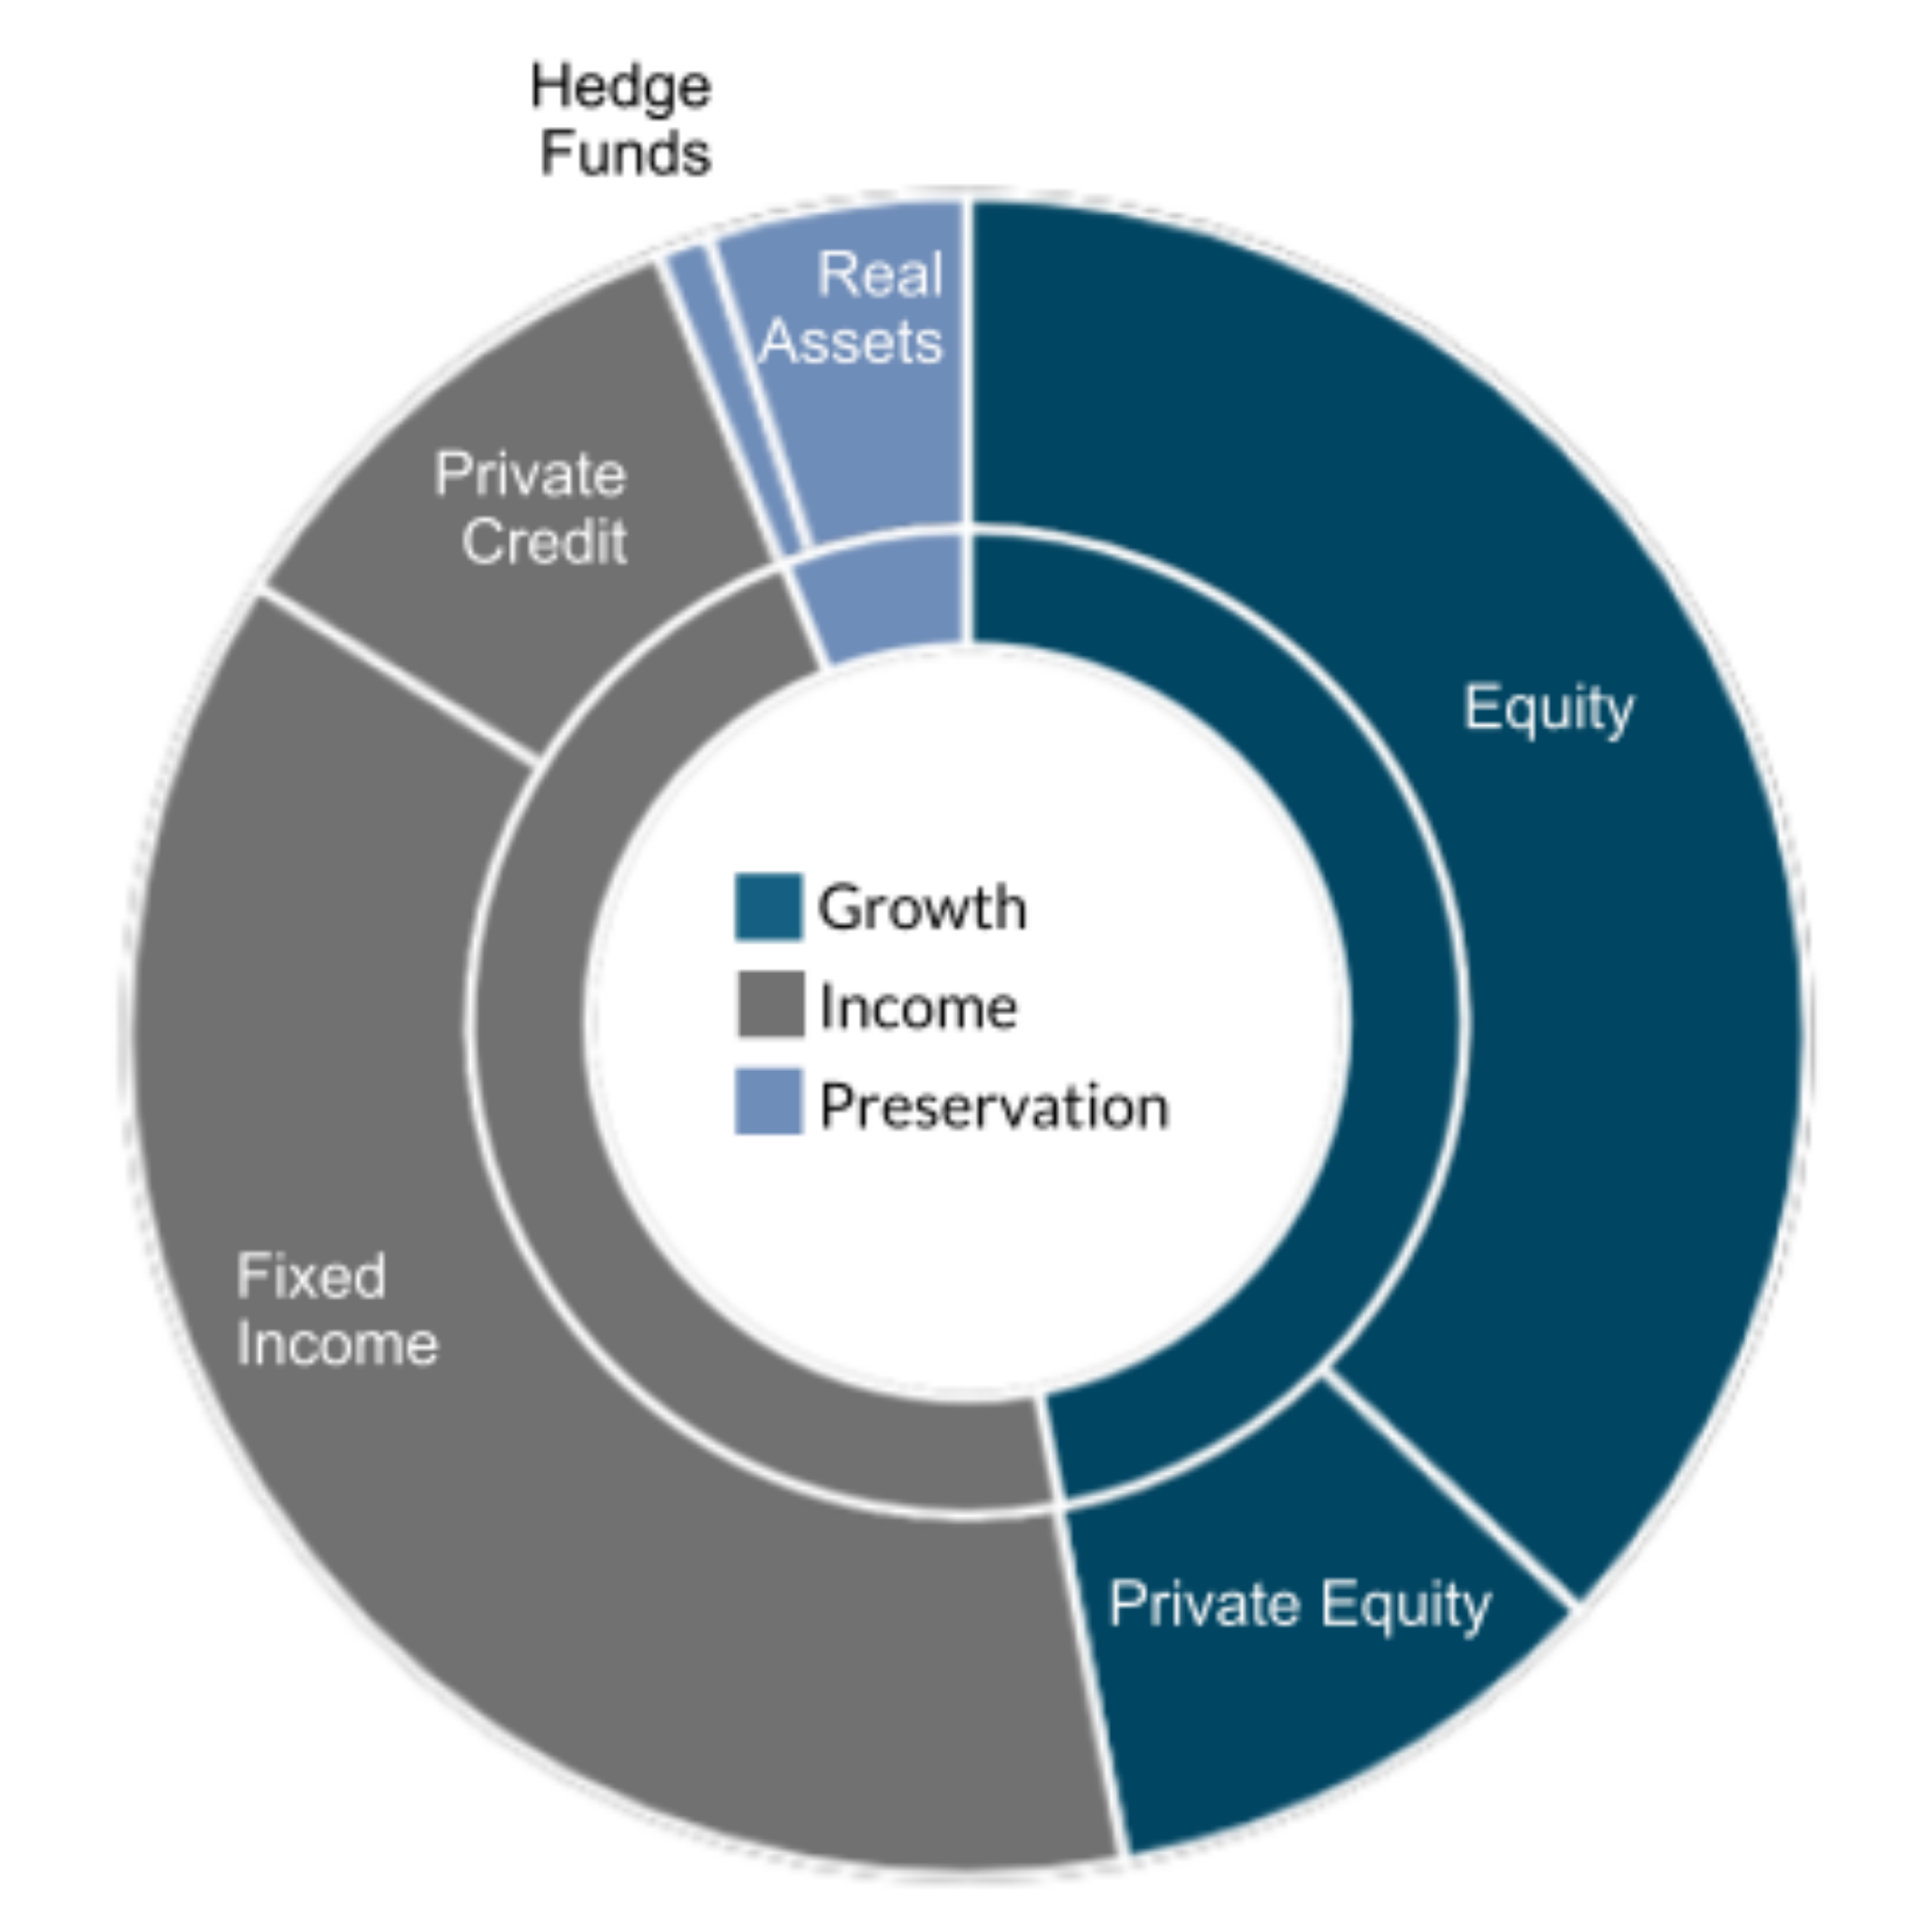
The combination of a goals-based asset allocation with the differentiating factors of alternative investments allows for simpler portfolio construction that broadens return drivers and aligns capital with client time horizons.
This sample allocation model demonstrates how, rather than treating alternatives as a standalone allocation, each strategy can serve a defined role within the portfolio.
Liquidity budgeting ensures these allocations are intentional. Illiquidity can be a feature when aligned with long-term capital, but sizing discipline is essential to preserve flexibility and rebalancing capacity.
The bottom line
When risk is allocated by objective rather than by asset label, alternatives become structural tools – not add-ons – improving diversification and outcome alignment without increasing complexity.
A disciplined goals-based framework, combined with intentional liquidity budgeting, allows advisors to integrate public and private markets with greater precision – aligning capital to time horizon, return needs, and risk tolerance.
Footnotes
1. Source: US Census Bureau – Statistics of US Businesses database as of December 2023, which represents latest data available through 2021. Public company count is from the World Federation of Exchanges database as of June 2024.
2. Historically, public equities and private credit have outperformed liquid credit over long horizons. For example, in the Cliffwater Direct Lending Index (CDLI) Q3 2023 report (data from Sep 2004–Sep 2023), private credit (CDLI) delivered 9.31% annualized since inception versus public liquid credit benchmarks: Bloomberg High Yield Bond Index 5.97%, Morningstar LSTA US Leveraged Loan Index 4.37%, and Bloomberg Aggregate Bond Index 2.98%.
Over the same report’s 10-year window, CDLI returned 8.89% annualized versus High Yield 4.02%, Leveraged Loans 3.65%, and Aggregate Bonds 1.06%.
For public equities vs. bonds, the Credit Suisse Global Investment Returns Yearbook (DMS database) shows equities were the best-performing asset class over the long run; for the USA (1900–2022) it reports annualized real returns of 6.4% for equities vs 1.7% for bonds (and 0.4% for bills).
Acknowledgment and Disclaimers
The materials contained herein are for information purposes only and do not constitute an offer to sell or a solicitation of an offer to purchase any interest in any investment vehicles.
Statements contained herein reflect the subjective views and opinion of Sagard and may not be able to be independently verified. These materials are being provided solely for informational purposes and are not intended to be, and shall not be regarded or construed as, rendering accounting, business, financial, investment, legal, tax, or other professional advice or services, nor as a recommendation for a transaction or investment, including without limitation an offer to purchase, sell or hold any security investment, loan or other financial product or to enter into or arrange any type of transaction. This publication is not a substitute for such professional advice or services, nor should it be used as a basis for any decision or action that may affect your business. Before making any decision or taking any action that may affect your business, you should consult a qualified professional advisor. Sagard shall not be responsible for any loss sustained by any person who relies on this publication.
Like all investments, an investment in private markets involves the risk of loss. Investment products such as private market investments are designed only for sophisticated investors who can sustain the loss of their investment. Accordingly, such investment products are not suitable for all investors. Private market investments are not subject to the same or similar regulatory requirements as mutual funds or other more regulated collective investment vehicles.
Certain statements and certain of the information contained in these materials represents or is based upon “forward-looking” statements or information based on experience and expectations about these types of investments. The forward-looking statements in these materials include statements with respect to, among other things, projections, forecasts or estimates of cash flows, yields or returns, scenario analyses or proposed or expected portfolio composition and anticipated future events, performance or expectations. Forward-looking statements are inherently uncertain and are not guarantees of future performance and are subject to many risks, uncertainties and assumptions that are difficult to predict. No representation or warranty, express or implied, is made as to any forward-looking statements and information and no undue reliance should be placed on such forward-looking statements and information. Sagard has no obligation and does not undertake to revise or update these materials or any forward-looking statements set forth herein, except as required by law.
The information in the attached materials reflects the general intentions of Sagard. There can be no assurance that these intentions will not change or be adjusted to reflect the environment in which Sagard will operate.
Past performance and historic information is not necessarily indicative of future activities or returns, and there can be no assurance that comparable results will be achieved.
No securities commission or regulatory authority in Canada has in any way passed upon the merits of an investment in private markets or the accuracy or adequacy of the information or material contained herein or otherwise.
The information contained herein is in summary form for convenience of presentation. It is not complete and it should not be relied upon as such. Sagard makes no representation or warranty, express or implied, as to the accuracy or completeness of the information contained herein.
All information is presented as of February 2026 unless otherwise stated.
Sagard Holdings Manager (Canada) Inc. is registered as an exempt market dealer in the provinces of British Columbia, Alberta, Manitoba, Ontario, Quebec, and Nova Scotia. The Ontario Securities Commission is the Principal Regulator of Sagard Holdings Manager (Canada) Inc.