

Christophe de Dardel
Chief Investment Officer
Sagard Private Equity

Prof. Rüdiger Fahlenbrach
Swiss Federal Technology Institute of Lausanne (EPFL) and Swiss Finance Institute
Overview
Private equity distributions have fallen to less than half their historical rate since 2022, and the drought has lasted long enough that it can no longer be explained away as a cyclical dip. GPs have responded with an expanding toolkit — continuation funds, NAV loans — that can ease near-term liquidity pressure, but each comes with trade-offs that LPs need to understand.
The central question is whether the industry is experiencing an extended cycle or a more persistent change in exit opportunities. Higher interest rates, weaker M&A activity and the valuation reset after 2021 explain much of the initial slowdown, but the current episode has persisted longer than previous downturns and affects funds across the age spectrum. Structural features of the market — larger funds, higher entry valuations, longer debt maturities and a narrower buyer universe — suggest distribution rates will not return quickly to their previous average. The distribution shortfall has increased demand for liquidity outside conventional exits, but continuation funds and NAV are not substitutes for a third-party sale.
This note examines what is driving the drought, why it may persist, and what it means for how LPs should underwrite managers and plan commitments.
Key Takeaways
- Private equity distributions have averaged less than half their historical rate since 2022 — and the drought is lasting longer than any prior one
- The exit market is not uniform: large buyouts are most affected by the draught while the mid-market has retained more robust exit routes
- Reported exit values and multiples are upward-biased — they only capture deals that closed, not assets pulled because bids were too low
- The refinancing wall has been pushed to 2028–2031, removing the pressure for GPs to sell
- Continuation funds and NAV lending can ease liquidity pressure, but none is economically equivalent to a third-party sale
- The exit drought may itself be accelerating LP migration toward semi-liquid structures — a demand-side dynamic that is underappreciated
- LPs need to assess not just how much DPI they received, but where it came from
The Exit Problem
Private equity allocations are managed through cash flows as well as reported valuations. Distributions from mature funds provide liquidity for new commitments and bring allocations back towards target. When those distributions slow, LPs must fund capital calls from cash reserves or other parts of the portfolio. Re-up capacity declines even when the reported value of the private equity portfolio remains stable.
The current shortfall is unusually persistent. Brown, Lundblad, Hu and Volckmann (2026) estimate that annual buyout distributions averaged about 12% of NAV in 2022–2025, less than half the rate recorded over the previous decade.
Longer holding periods have increased the stock of unrealized assets. Abuzov et al. (2026) report that a dollar invested in private equity in 2014 still had about $0.58 of unrealized value ten years later, compared with about $0.20 for a dollar invested in 1994. The comparison does not imply that the residual assets are impaired, but it shows how much more of the return now remains dependent on future exits.
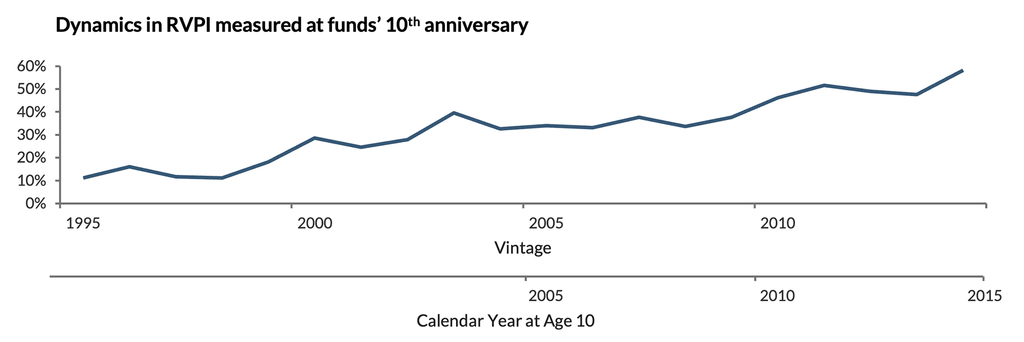
Figure 1. Unrealized residual value per dollar invested, 1994 vintage vs. 2014 vintage. Source: Abuzov et al. (2026).a
DPI is The New IRR
- Market participants increasingly use this expression to describe the weight placed on realized cash. IRR and TVPI remain important performance metrics, but mature funds are now judged more closely on their ability to convert reported value into distributions.
- The source of the distribution remains important. Cash generated by a third-party sale, a continuation fund transaction, and a NAV-funded distribution do not have the same economic content. A sale removes the asset from the fund and provides an external price. A continuation transaction changes the investor base while the GP retains the asset. A NAV loan brings forward cash and adds a senior claim on future proceeds.
- DPI can rise while the residual fund becomes more leveraged, more concentrated or longer-dated. LPs therefore need to assess the amount, timing and source of distributions together.
The refinancing wall provides a further structural explanation for the persistence of weak exits in the large-cap segment. As the chart below shows, the peak of European leveraged loan maturities has shifted materially: the wall that once loomed in 2026–2028 has been pushed back to 2028–2031, reducing the immediate pressure for GPs to sell. This extension of maturities allows sponsors to wait for better exit conditions — but it also prolongs the distribution drought for LPs.
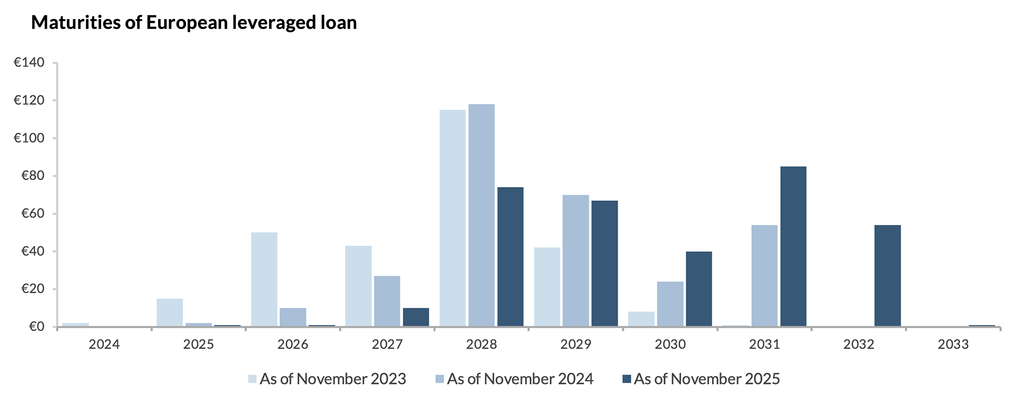
Figure 2. Maturities of European leveraged loans (€ billion) as of November 2023, November 2024 and November 2025. Source: PitchBook; LCD; Morningstar European Leveraged Loan Index.
Standard Cycle or a New Exit Regime?
Private equity exits are cyclical. IPO windows open and close, strategic buyers adjust acquisition budgets, credit conditions affect buyouts by other private equity firms and valuation multiples move with discount rates. Distributions are more sensitive to these conditions than capital calls, which makes net cash flows procyclical. Weak distributions after the rise in interest rates and the 2021 valuation peak were therefore not unexpected.
Several observations support a cyclical interpretation. Short-term rates rose rapidly, leveraged acquisition financing became more expensive and public and private transaction multiples reset. Rapid fundraising increased the weight of younger vintages, reducing aggregate distributions even before exit conditions weakened. Similar distribution troughs occurred after the technology bubble and during the global financial crisis.
Signs of a more persistent regime change come from the duration of the weak exit environment. Earlier periods with distribution rates below 15% of NAV did not last as long as the current period. Brown et al. (2026) find that Distribution rates since 2022 have been lower across almost every fund age rather than driven only by the age composition of the market. They also find that historical macroeconomic, valuation and fund-level variables explain much of the initial decline, but their model predicts a materially stronger recovery than occurred through the end of 2025. Observed exits in 2023–2024 were about 17% below the model estimate, with the largest shortfall in financial sales. The low number of completed exits also creates an important selection issue when interpreting reported exit values and multiples. These statistics are conditional on a transaction taking place. In a weak market, GPs are more likely to sell assets for which bids meet or exceed their reservation price, while assets attracting lower bids remain unsold. Completed transactions therefore represent a selected sample, and strong realized multiples do not reflect the prices at which the broader portfolio could be sold.
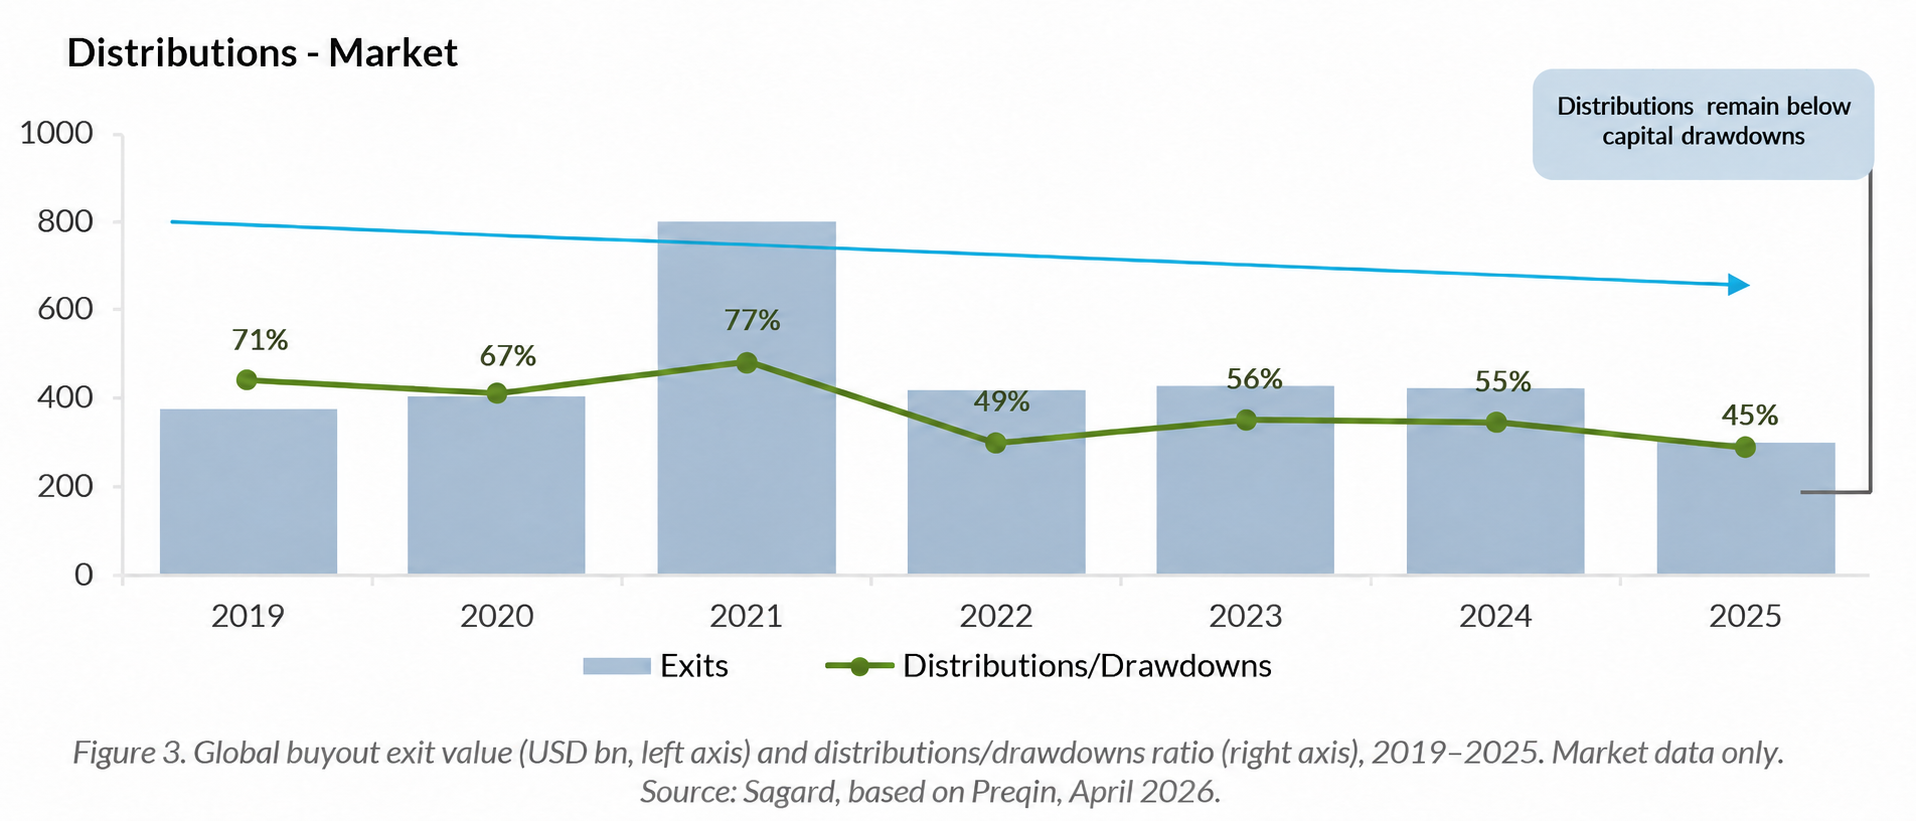
Figure 3. Global buyout exit value (USD bn, left axis) and distributions/drawdowns ratio (right axis), 2019–2025. Market data only. Source: Sagard, based on Preqin, April 2026.
Exit Market Heterogeneity
Exit conditions differ materially by deal size, geography, sector and buyer type. Market participants report the greatest pressure in large U.S. and European buyouts. These transactions require large equity contributions, substantial financing packages and a buyer confident that future earnings growth will justify the asking price. That pool of potential buyers is narrow.
Small and medium-sized companies generally have more exit routes. Strategic buyers can value product fit, customer access and geographic expansion; financial buyers can value defensible market positions, recurring revenues and room for further consolidation. The required financing package is smaller and a wider range of acquirers can participate. Outcomes still vary by sector and asset quality, but the small- and mid-market segment has been materially less affected than the large- and mega-buyout segment.
DOVIDA: WHAT MAKES A MID-MARKET ASSET SELLABLE
Dovida is a provider of essential home care services, including personal care, nursing and domestic support, operating across Switzerland, France, the Netherlands, Ireland, Australia and New Zealand. The company was sold by Sagard for >2.5x net performance in 2025, after 3.8 years of ownership.
The asset illustrates what buyers look for in a difficult exit environment:
- A clearly defined market position in a non-cyclical, socially essential sector
- A consistent double-digit EBITDA margins on revenues that more than doubled over the holding period
- A multi-geography footprint with room for further expansion
These are characteristics that travel — they are legible to a range of potential acquirers regardless of their own strategic profile. The exit confirmed that in the mid-market, asset quality and narrative clarity matter as much as market conditions.
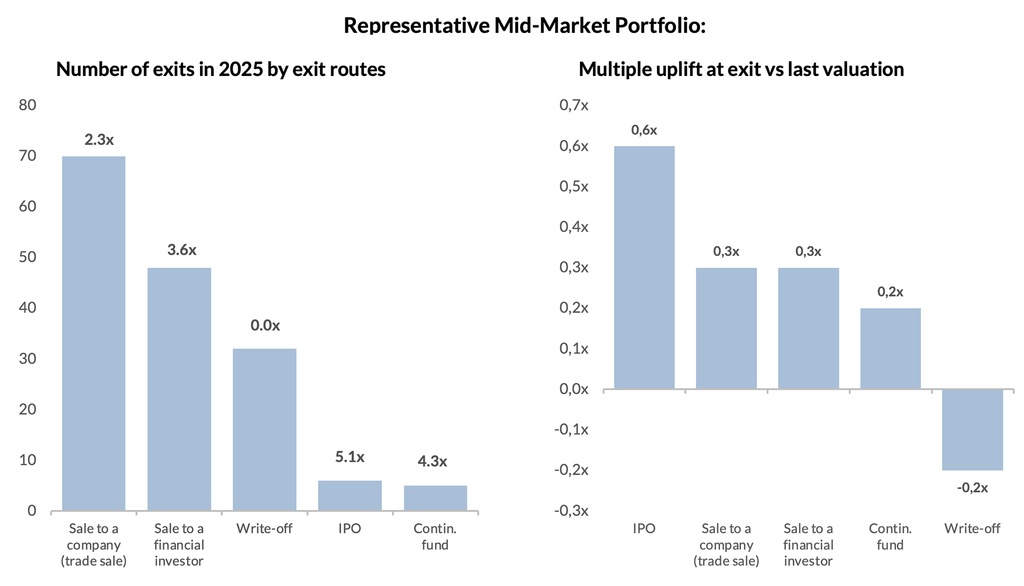
Figure 4. Number of exits by buyer type (left) and MOIC uplift at exit vs. last quarterly valuation by buyer type (right), Sagard portfolio, 2025. Source: Sagard, April 2026.
This heterogeneity limits the value of a single forecast for “the exit market”. LPs should assess each residual portfolio by enterprise value, leverage, holding period, sector, buyer universe and likely exit route. A portfolio of specialized mid-market businesses has a different distribution path from a concentrated large-cap fund even when both face the same macroeconomic environment.
Liquidity Generation
In private equity liquidity mechanisms differ along two dimensions: whether they operate at the asset or fund level, and whether they apply to an individual LP or to all LPs. The distinction clarifies who receives cash, which assets are affected and whether the transaction produces an external exit.
In private equity liquidity mechanisms differ along two dimensions: whether they operate at the asset or fund level, and whether they apply to an individual LP or to all LPs. The distinction clarifies who receives cash, which assets are affected and whether the transaction produces an external exit.
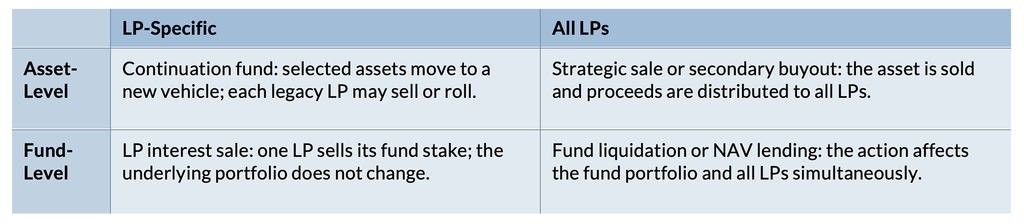
Figure 5. Main liquidity mechanisms. Source: Adapted from Abuzov et al. (2026) and Sagard.
An external asset sale validates the price and removes the asset from the legacy fund. A continuation fund gives LPs the choice to sell or roll while retaining the asset under the same GP. An LP-led secondary provides liquidity to one investor without changing the underlying portfolio. NAV lending changes the timing and seniority of fund cash flows without transferring asset ownership.
The matrix also shows why distribution figures alone are insufficient. The same amount of DPI can represent an external realization, a transfer to another vehicle or debt secured against future proceeds. The discussion below focuses on continuation funds and NAV lending, which can generate distributions without an external asset sale.
Continuation Funds
A continuation fund transfers one or more assets from an existing fund into a new vehicle managed by the same GP. Legacy LPs can sell their exposure or roll it into the new vehicle. New investors, usually secondary specialists, finance the cash paid to exiting LPs and may provide additional capital for acquisitions or organic growth.
The structure addresses a genuine mismatch. A GP may believe that an asset has further value-creation potential, while some LPs need cash or cannot extend duration. A continuation fund allows those decisions to be separated. It can avoid a sale at a price that the GP considers unattractive and give liquidity to investors that prefer to exit.
What the Academic Evidence Shows
Abuzov et al. (2026) assemble a dataset of 532 continuation funds. Continuation funds are generally formed late in the legacy fund’s life and are more common in larger, better-performing funds. The transferred assets have higher RVPI and IRR than assets retained in the same legacy funds. The evidence is inconsistent with the view that continuation funds are used mainly to warehouse weak assets.
The same study shows how quickly the market has expanded. Continuation funds represented about 9% of PE exits in 2024, with approximately $75 billion of transaction value, and more than 100 vehicles were launched in each of 2024 and 2025.
Only about 5% of 911 observed LP–continuation-fund decisions in Abuzov et al. (2026) resulted in a rollover. The sample focuses on U.S. public institutional LPs and is decision-weighted rather than capital-weighted. Ivashina, Mayer and Phalippou (2026) report a separate market estimate: about 10% of legacy LP capital by volume tends to roll into a continuation vehicle. Many LPs cannot roll because their mandates prohibit concentrated exposure to a single asset. Others need liquidity or cannot complete underwriting within the time available. And others simply “eat when the appetizers are served”.
Market participants generally viewed the first generation of continuation funds as a good solution for a limited set of high-quality assets. The rapid increase in their share of transactions is changing that assessment. The scale of issuance suggests that continuation funds are increasingly used to generate distributions, rather than only to finance companies that would benefit from additional time under private equity ownership. As they become a mainstream exit channel, the distribution of asset quality, pricing discipline and sponsor motivation is likely to widen. LPs should distinguish selective use from recurrent use across a manager’s portfolio and pay particular attention to governance.
The GP’s Dual Role and Best Practices
The GP both represents the selling legacy fund and manages the buying continuation vehicle. Because the transfer price affects exiting LPs, rolling LPs, new investors and the GP’s economics differently, the transaction creates an inherent conflict of interest. Ivashina, Mayer and Phalippou (2026) show that the conflict can run in either direction, depending on the quality of the asset and the GP’s economic exposure to the two vehicles.
Against this background, the GP should clearly articulate why a continuation fund is preferable to the two principal alternatives: a third-party sale or continued ownership by the legacy fund. The relevant question is whether the transfer increases expected value, net of fees and transaction costs, for rolling LPs while providing a fair price to those who choose to exit.
Competitive price discovery, full disclosure and a reasonable election period are central to fair treatment. Best practice requires a competitive auction or comparable third-party process, potentially supported by an independent valuation. Legacy LPs should receive sufficient information and time to make an informed decision.
Fees, carried interest and GP commitments should be structured to limit conflicts between the legacy fund and the continuation vehicle. The rollover of carried interest and co-investment by the GP can improve alignment in some circumstances, but do not remove the underlying conflict.
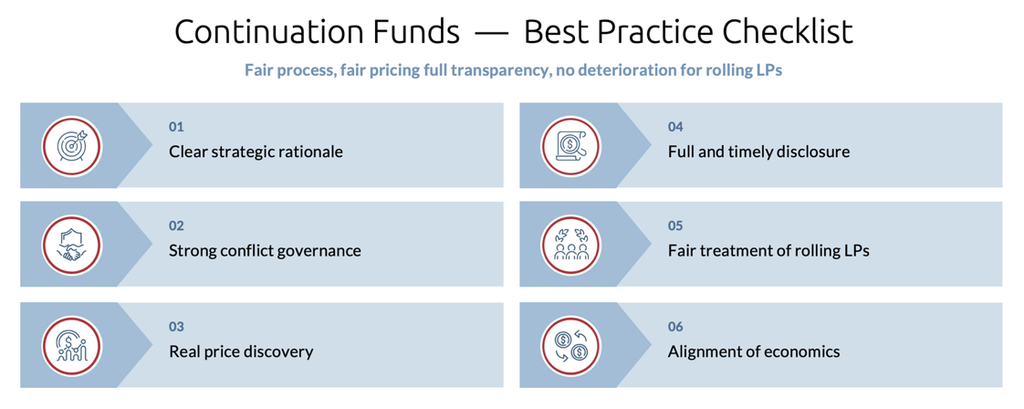
Figure 6. Continuation fund best-practice checklist. Source: Sagard, April 2026.
NAV Lending
A NAV loan is secured against the value of a fund’s remaining portfolio. Proceeds can finance follow-on investments, meet fund obligations or fund distributions. The first two uses may support asset value. The third changes the timing and seniority of cash flows without completing an exit.
NAV borrowing is, however, expensive. Market data presented by PitchBook, LCD and the Morningstar European Leveraged Loan Index indicate all-in costs in 2025 of approximately 5.5% for senior low-LTV structures, about 6% for higher-LTV senior loans and about 8% for mezzanine or unsecured structures. Costs peaked around 6.8%–9% in 2023 and remain well above the 3.5%–5% range observed before 2021.
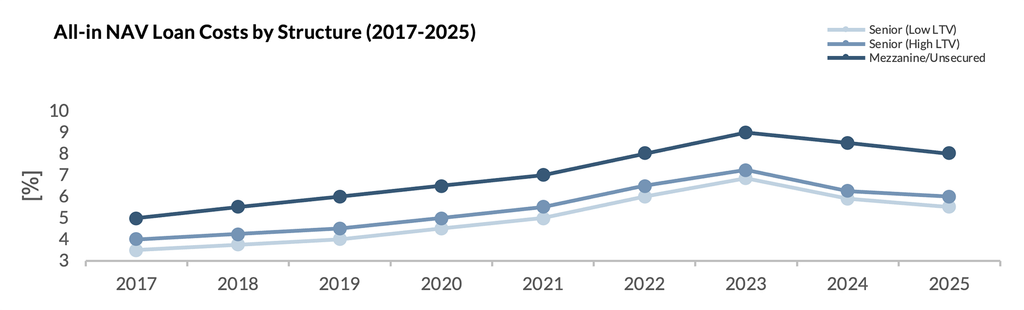
Figure 7. All-in cost of NAV loans (%), 2019–2025, by structure type. Source: PitchBook; LCD; Morningstar European Leveraged Loan Index, data through November 2025.
The cost creates a high hurdle. Illustrative (hypothetical) example — assuming a two‑year NAV loan equal to 10% of a fund’s NAV at a 7% annual interest rate, the simple‑interest financing cost would be approximately 1.4% of NAV before fees1.
Borrowing to defer a sale adds value only if the eventual improvement in proceeds exceeds the financing cost and the risk from additional fund-level leverage.
When used solely to fund distributions, NAV lending has a weak value proposition: it brings forward cash but reduces future distributions through principal, interest and fees. Fund-level borrowing also links assets that would otherwise be economically separate. A write-down in one portfolio company, covenant breach or delayed exit can reduce GP flexibility and increase pressure to sell.
Some LPAs permit limited NAV borrowing without an LP vote. LPs should therefore monitor facility use and disclosure closely.
1This is an illustrative calculation only (assumes simple interest, no fees, no compounding, no prepayment, and no lender-specific terms) and is not actual performance. Actual financing costs will vary by lender, loan structure, fees and timing. This example is provided solely to illustrate the potential financing cost and limitations; borrowing only adds value if any expected improvement in exit proceeds exceeds these costs and the additional risks associated with fund‑level leverage.
Semi-Liquid Vehicles
In recent years, GPs have launched numerous semi-liquid, evergreen investment vehicles with the aim of expanding the investor base for private equity, particularly by tapping into the high-net-worth individual segment. These vehicles were not originally conceived as a response to the slowdown in exits — they do not provide liquidity to existing funds. The prolonged exit draught has nonetheless accelerated their growth, insofar as investors themselves, caught in the drought, have increasingly valued the liquidity provisions of semi-liquid structures relative to the long-term lock-up associated with traditional closed-end commitments.
Evergreen private equity vehicles replace the commitment-and-call model with regular subscriptions at NAV and periodic repurchase offers. “Semi-liquid” describes the repurchase framework, not the liquidity of the underlying assets.
Repurchases are funded by cash, new subscriptions, credit facilities, or asset sales. New subscriptions may slow when redemption requests rise, credit capacity is finite and asset sales are most difficult in a weak exit market. Repurchase caps, proration and gates are commonly included features of many semi-liquid structures to manage liquidity risk, though their design varies by vehicle and should be reviewed on a case-by-case basis2. Investors with a long horizon can benefit from diversified exposure and relief from capital-call logistics — but suitability depends entirely on the ability to tolerate delayed or suspended liquidity.
Additional governance is required when an evergreen vehicle acquires assets from affiliated closed-end funds. The transaction can give liquidity to existing LPs while incoming investors assume the remaining duration and valuation risk — an asymmetry that makes independent pricing, disclosure of alternatives, treatment of accrued carry and allocation of transaction costs especially important. The growth in semi-liquid vehicles has in part been driven by the prolonged slowdown in exits; as their use increases, LPs should subject such vehicles to the same scrutiny they apply to continuation funds.
Selecting the right semi-liquid vehicle requires the same discipline as any other manager selection decision — arguably more, given the structural complexity involved. As with continuation funds, a checklist approach can help LPs move beyond the appeal of periodic liquidity and ask the questions that matter. Four areas are particularly important: the quality and depth of the underlying exposure, the source of value creation, portfolio construction discipline, and the credibility of the liquidity framework.
2Certain statements above are based on the subjective views and analysis of Sagard and cannot be independently verified.
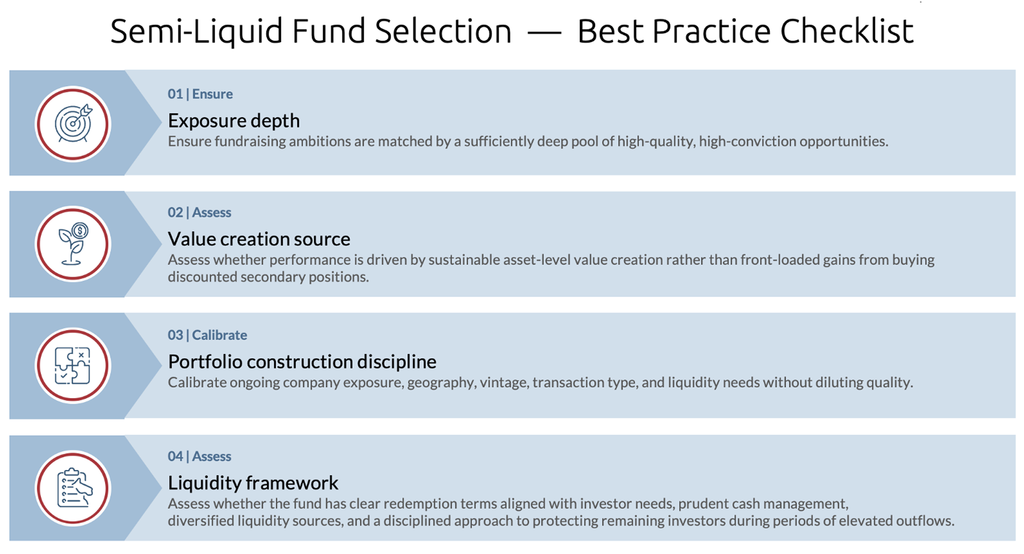
Figure 8: Semi-liquid fund selection checklist. Source: A. Falin, M. I. Vivas, Understanding the Semi-Liquid Revolution, Sagard
Implications for LPs
The exit drought has increased the importance of realization analysis. While historical IRR and TVPI remain important, they are increasingly viewed as only part of the picture. Greater weight is now placed on DPI, cash-on-cash returns, the sources and quality of distributions, the composition of residual NAV and the expected timing of future realizations. Taken together, these factors provide a more complete assessment of both a fund’s realized performance and its prospects for future value creation.
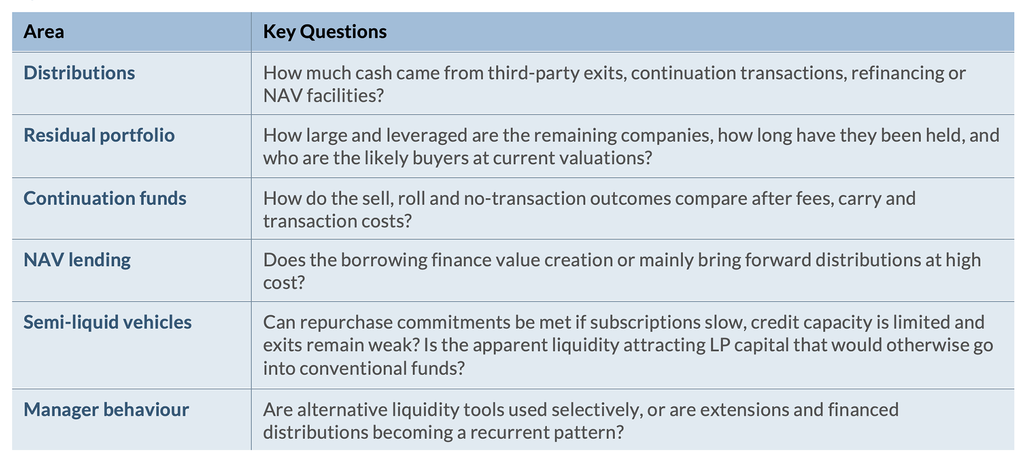
Figure 9. Questions for LPs
Patience can be rational when operating progress is evident, leverage is manageable and the expected return compensates for the additional time and risk. It is less persuasive when the case depends mainly on multiple recovery or further refinancing.
Manager-level patterns matter. A continuation fund used selectively for a strong asset can preserve value and accommodate different LP liquidity needs. Yet, repeated extensions, related-party transfers and debt-funded distributions may indicate that portfolio marks are not clearing in external markets — and that the GP is managing optics rather than capital.
LP commitment pacing should allow for greater distribution uncertainty. Scenario analysis should distinguish by fund age, strategy, company size and expected exit route. The bar for re-up should be set with explicit reference to DPI, the composition of residual NAV and the manager’s track record in using alternative liquidity mechanisms.
The conclusion is straightforward, if uncomfortable: cash from an external realization and liquidity manufactured within the private equity system are not economically equivalent. LPs who treat them as such will systematically overestimate both realized performance and the pace at which capital will be returned. The exit drought is not simply a market condition to be waited out — it is a structural shift that requires a more rigorous framework for evaluating managers, monitoring portfolios and planning commitments.
Sources
Abuzov, R., Gornall, W., Shive, S., Strebulaev, I.A. and Weisbach, M.S. (2026). “Selling to Yourself: Continuation Funds in Private Equity.” Working paper, 22 March 2026.
Bain & Company (2026). Global Private Equity Report 2026.
Brown, G., Lundblad, C., Hu, W. and Volckmann, W.M. II (2026). “Buyout Fund Exits and Distributions.” Institute for Private Capital working paper, 20 May 2026.
Ivashina, V., Mayer, S. and Phalippou, L. (2026). “Private Equity Continuation Vehicles: A Model of Strategic Asset Transfers.” Working paper, 27 February 2026.
PitchBook, LCD and Morningstar European Leveraged Loan Index. NAV loan cost data through November 2025.
A. Falin, M. I. Vivas, Understanding the Semi-Liquid Revolution, Sagard
Important Disclosures
For Informational Purposes Only: This material has been prepared for informational and discussion purposes only and does not constitute investment advice, an offer to sell, or a solicitation of an offer to purchase any security or investment product. Certain statements above are based on the subjective views and analysis of Sagard and cannot be independently verified.
Forward-Looking Statements: Certain statements reflect current opinions, expectations, and projections regarding market conditions, industry trends, and future developments. These statements are based on assumptions that may not materialize, and actual outcomes may differ materially. Third-Party Information: Certain information has been obtained from third-party sources believed to be reliable but has not necessarily been independently verified. No representation or warranty is made regarding the accuracy or completeness of such information.
Investment References: References to specific investments are provided for illustrative purposes only and are not intended to represent all investments made by Sagard. The investments discussed should not be considered representative of all investment outcomes, and past performance is not indicative of future results.